
Analysis of housing data is of interest at all ages and for all age groups. Several analytical methodologies are there to empower the curious minds interested in deriving insights and trends from housing data. In this blog, I talk about a methodology that aids in understanding the factors involved in the time (or number of days) it takes for a home to get sold in the current market.
The number of days a house is on the market is an important parameter for a home buyer, home seller as well as for real estate professionals. The prices of homes in a region of interest is given by the average or mean statistic whereas the number of days a house is in the market is given by the median statistic. The mean and median referred to as central tendencies are important statistics and are dependent on each other. A statistical model around mean or median is a valuable tool for understanding the housing market. Looking at mean and median together tells of any interesting skewness present in the data, about any disparities in home values and sometimes it even helps to check the quality of the data. A median is the middle number in the data when all the values are arranged in an ascending order. Median is also referred to as 0.50 quantile. A mean is the sum of all the values divided by the total number of homes used in getting the sum of all the values.
To elaborate on how mean and median together help in interpretation of data, let’s consider a data that has the list of all home prices. If the mean of home prices is equal to the median of the home prices, then it is a symmetric data and tells that there are homes with prices equally distributed across the entire range. If the mean listing price is lower than the median listing price, it indicates that there are more homes in the lower range of prices such that it brings down the mean lower than the median of the home prices. Vice-versa, if the mean listing price is higher than the median listing price it indicates that there are more homes with prices in the higher end that it takes the mean higher than the median.
I took the housing inventory data from FRED database for analysis. I took sample data by narrowing down the data for the months of September 2023, September 2024, September 2025. Depending upon the objective of the analysis, we can collect data for more required quarters. For this blog the aim is to brief on Quantile Regression methodology that can be used as a methodology to build a model that analyzes the different parameters and their magnitude in explaining the difference in the number of days it takes to sell a house in the market.
Data Analysis
Data interpretation based on Visual charts
The following chart shows the median (i.e. middle number) number of days it took for a house to sell in the market in the month of September for the past 3 years.
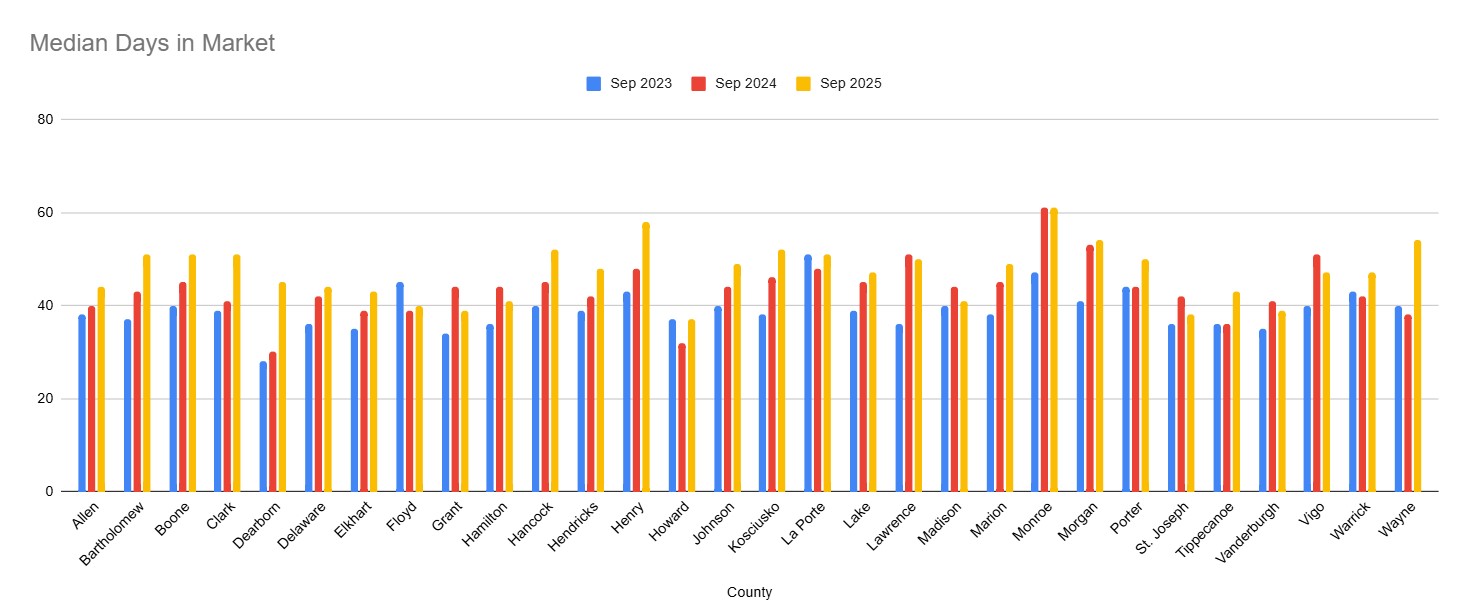
Based on the chart, the number of days increased for the majority of the counties. Few counties such as Flyod, Grant, Hamilton, Madison, St.Josephs showed a decrease which says the trend shows it is taking fewer days compared to the previous year to sell a house in these counties. Monroe county did not show a change in 2025 compared to 2024.
Data interpretation based on Summary statistics
The following is the summary statistics for the numerical parameters present in the data.
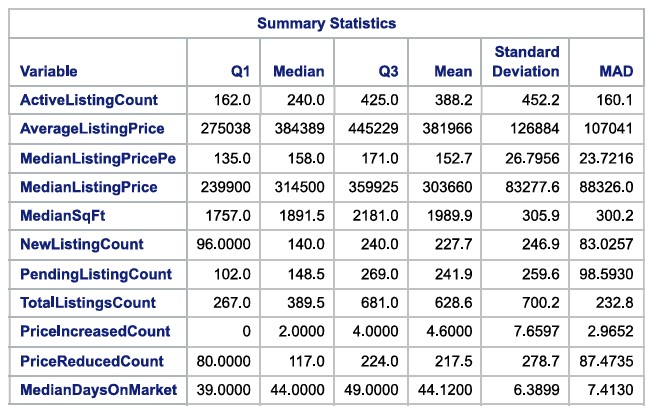
The above table has the parameters that will be used for building a statistical model around Median Days on Market. Q1 is the 0.25 quantile and this value separates the lowest 25% of data and the highest 75% of data. Median is 0.5 quantile and is the middle value, i.e. 50% of data are below this value and 50% above this value. Q3 is the 0.75 quantile and this value separates the lowest 75% of data from the highest 25% of data.
Looking at Mean and Median together provides interesting insights. Mean is greater than median for the parameters – Active Listing Count, Median square foot., New Listing Count, Pending Listing Count, Total Listing Count, Price Increased Count, Price Reduced Count. From this summary, it is possible to infer that there were a greater number of homes listed for sale.
Similarly, the parameters which have mean lesser than the median are Average Listing Price, Median Listing Price per square feet, Median Listing price. From this summary statistic, it is possible to infer that there were a greater number of lower range priced homes for sale.
Putting all these parameters together, it can be interpreted that based on the data collected in September 2023, September 2024, September 2025 the housing market in the counties in Indiana had a greater number of lower-end priced homes listed in the market.
Data interpretation based on Quantile Regression
Quantile regression is a statistical method that can be used to model data and decipher relationships between dependent variable and predictor variables based on a quantile estimate. Since the analysis is based on quantiles, it is possible to do more complete analysis when the data is not uniform across all variables. This method is applicable when the data is skewed and has outliers. Quantile regression gives better models where the outcome and the data relationship can be analyzed by each quantile at different significance levels. The significance of parameters and their contribution to overall prediction can be studied and can be known at the quantile level at which they are significant. In a business context, this can be interpreted as that those houses that were sold in that x quantile of days had certain parameters which were significant. Those parameters can be highlighted in a marketing material or can be strategized for improvement to achieve quicker sales.
For the data used in the analysis, parameters were significant only at 0.1 and 0.15 quantiles.
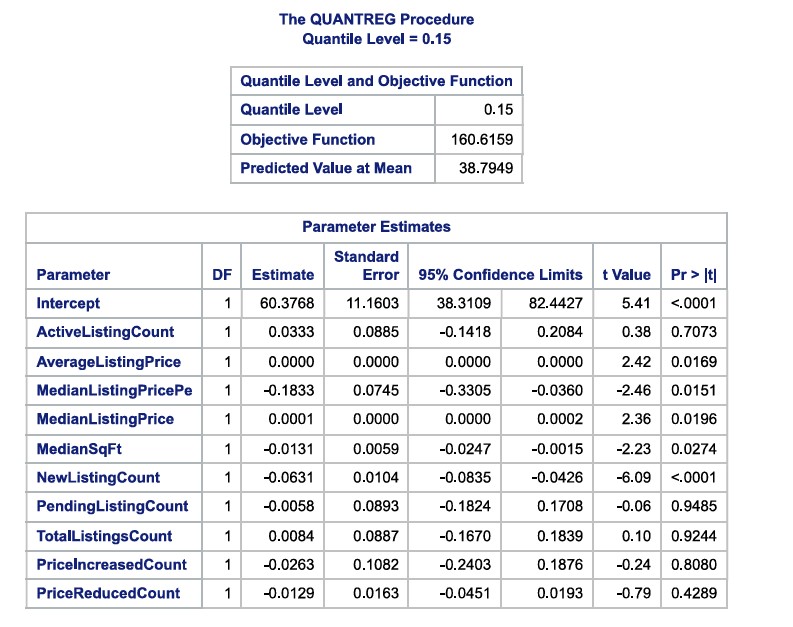
The parameters significant at 5% significance level at 0.15 quantile are Average Listing Price, Median Listing Price Per Square foot, Median Listing price, Median Square feet, New Listing count. They have probability values (listed in last column) less than 0.05 (5%) and hence are significant at this level.
In a business context, this can be read as for those houses which are in the lower 15% values, the above parameters were significant factors in home sales. The average number of days in 15% quantile is 38.8 days. Hence for those houses which got sold in 38.8 days, the above parameters were significant criteria. For instance, a unit change in the median listing price square foot parameter negatively impacted the number of days a house was in the market. It brought down the number of days a house is on the market. Similarly, a unit change in the median listing price increased the number of days in the market by a factor of 0.0001. Similar interpretations can be done for each parameter and based on the interpretation, marketing and sales strategies can be revised to have quicker turnaround in sales.
Further the above analysis conveys that this model for this data is significant only for houses which are in the lower 15% values, i.e. for those houses which got sold in very less number of days. This model is not significant for those houses which took more days to sell. Hence strategies that were developed for quickly sold houses based on this data may not work well for those houses which were in the market for a higher number of days.
Conclusion
In this blog, I described how Quantile Regression statistical methodology can be used to explain the difference in the number of days it takes for a house to sell in the market. While the model outputs numbers and parameters, it is left to the analyst and real estate professionals to intelligently and pragmatically analyze the numbers and outputs to develop targeted marketing and sales strategies to improve business conditions. Quantile regression helps to study for each segment of the data which allows for developing targeted strategies for individual segments rather than for the entire segment as a whole. Based on the objective and resources (data, funding) available, data can be collected and analyzed to arrive at recommendations for business improvement. My objective for this blog was to briefly describe quantile regression methodology for home data analysis and I explained with 3 months of data in the past 3 years which had only 150 observations. I summarized and inferred the statistical outputs with this amount and level of data. For real-time action-oriented analysis, more data will be required. Data collection and data analysis will go iteratively until it becomes possible to arrive at actionable recommendations.
Image Courtesy: Image from Freepik
https://www.freepik.com/free-photo/house-with-sold-yard-sign_25625079.htm”>Image by freepik


Leave a Reply